


presentation of Edwards & Penney's work, by Corry Shores
[Search Blog Here. Index-tags are found on the bottom of the left column.]
[Central Entry Directory]
[Mathematics, Calculus, Geometry, Entry Directory]
[Calculus Entry Directory]
[Edwards & Penney, Entry Directory]
Edwards & Penney's Calculus is an incredibly-impressive, comprehensive, and understandable book. I highly recommend it.
[the following will not stray from Edwards & Penney's procedure, so it is largely quotation.]
Consider the slope-intercept equation
y = mx + b
of the straight line with slope m = tanφ, angle of inclination φ, and y-intercept b.

The "rise over run" definition

of the slope

leads to the point-slope equation

of the straight line with slope m that passes through the point


In either case a point (x, y) in the xy-plane lies on the line if and only if its coordinates x and y satisfy the indicated equation.
If Δy = 0 in this equation
then m = 0 and the line is horizontal. If Δx = 0, then the line is vertical and (because we cannot divide by zero) the slope of the line is not defined. Thus:
1) Horizontal lines have slope zero.
2) Vertical lines have no defined slope at all.
Example 1:
Write an equation of the line L that passes through the point P (3, 5) and is parallel to the line having equation y = 2x - 4.
Solution:
The two parallel lines have the same angle of inclination φ

and therefore have the same slope m. Comparing the given equation y = 2x - 4 with the slope-intercept equation in
y = mx + b
we see that m = 2. The point-slope equation therefore gives
y - 5 = 2(x - 3)
and alternatively, y = 2x - 1, for an equation of the line l.
Equations
y = mx + b
and
can both be put into the form of the general linear equation
Ax + By = C
Conversely, if B ≠ 0, then we can divide the terms in
Ax + By = C
by B and solve for y, thereby obtaining the point-slope equation of a straight line. If A = 0, then the resulting equation has the form y = H, the equation of a horizontal line with slope zero. If B = 0 but A ≠ 0, then the equation
Ax + By = C
can be solved for x = K, the equation of a vertical line (having no slope at all). In summary, we see that if the coefficients A and B are not both zero, then
Ax + By = C
is the equation of some straight line in the plane.
Graphs of More General Equations:
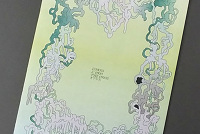
A straight line is a simple example of the graph of an equation. By contrast, a computer-graphing program produced the exotic curve shown in this diagram:

when it was asked to picture the set of all points (x, y) satisfying the equation

Both a straight line and this complicated curve are examples of graphs of equations.
Definition: Graph of an Equation
The graph of an equation in two variables x and y is the set of all points (x, y) in the plane that satisfy the equation.
For example, the distance formula of the below figure

tells us that the graph of the equation

is the circle of radius r centered at the origin (0,0). More generally, the graph of the equation

is the circle of radius r with center (h, k). This also follows from the distance formula, because the distance between the points (x, y) and (h, k) in the figure below is r.

Example 2: The equation of the circle with center (3, 4) and radius 10 is

which may also be written in the form

Translates of Graphs
Suppose that the xy-plane is shifted rigidly (or translated) by moving each point h units to the right and k units upward. (A negative value of h or k corresponds to a leftward or downward movement.) That is, each point (x, y) of the plane is moved to the point (x + h, y + k); see this figure below

Then the circle with radius r and center (0, 0) is translated to the circle with radius r and center (h, k). Thus the general circle described by the equation
is a translate of the origin-centered circle. Note that the equation of the translated circle is obtained from the original equation by replacing x with x - h and y with y - k. This observation illustrates a general principle that describes equations of translated (or "shifted") graphs.
Translation Principle:
When the graph of an equation is translated h units to the right and k units upward, the equation of the translated curve is obtained from the original equation by replacing x with x - h and with y - k.
Observe that we can write the equation of a translated circle in the equation
in the general form

What, then, can we do when we encounter an equation already of the form above? We first recognize that the graph is likely to be a circle. If so, we can discover its center and radius by the technique of completing the square. To do so, we note that

which shows that

can be made into the perfect square

by adding to it the square of half the coefficient of x.
Example 3:
Find the center and radius of the circle that has the equation

Solution:
We complete the square separately for each of the variables x and y. This gives

Hence the circle - shown in the figure below

has center (2, -3) and radius 5. Solving the last equation for y gives

that describes its upper and lower semicircles.
Graphs of Functions
The graph of a function is a special case of the graph of an equation.
Definition: Graph of a Function
The graph of a function f is the graph of the equation y = f (x).
Thus the graph of the function f is the set of all points in the plane that have the form (x, f (x)), where x is in the domain of f.

Because the second coordinate of such a point is uniquely determined by its first coordinate, we obtain the following useful principle:
The Vertical Line Test:
Each vertical line through a point in the domain of a function meets its graph in exactly one point.
Thus no vertical line can intersect the graph of a function in more than one point. For instance, it follows that the curve in the figure below
cannot be the graph of a function, although it is the graph of an equation. Similarly, a circle cannot be the graph of a function.
Example 4:
Construct the graph of the absolute value function
f (x) - | x |.
Solution:
Recall that

So the graph of y = | x | consists of the right half of the line y = x together with the left half of the line y = -x, as shown below

Parabolas:
The graph of a quadratic function of the form

is a parabola whose shape resembles that of the particular parabola in Example 8 below.
Example 8:
Construct the graph of the parabola

Solution:
We plot some points in a short table of values.

When draw a smooth curve through these points, we obtain the curve shown below:

The parabola

would look similar to the one below
but it would open downward instead of upward. More generally, the graph of the equation

is a parabola with its vertex at the origin, provided that a ≠ 0. This parabola opens upward if

and downward if

from Edwards & Penney: Calculus. New Jersey: Prentice Hall, 2002, p.12a-17b.
No comments:
Post a Comment